Note
Click here to download the full example code
Filter Out Background Noise
Filter out background noise from noisy speech signals.
To see how soundpy implements this, see soundpy.builtin.filtersignal.
As a general note for filtering, the Wiener Filter is the default filter for soundpy. It seems to filter signals more consequently than the Band Spectral Subtraction Filter.
# Let's import soundpy, and ipd for playing audio data
import soundpy as sp
import IPython.display as ipd
Define the noisy and clean speech audio files.
Note: these files are available in the soundpy repo. Designate path relevant for accessing audiodata
sp_dir = '../../../'
Noise sample:
noise = '{}audiodata/background_samples/traffic.wav'.format(sp_dir)
noise = sp.string2pathlib(noise)
speech = '{}audiodata/python.wav'.format(sp_dir)
speech = sp.utils.string2pathlib(speech)
For filtering, we will set the sample rate to be quite high:
sr = 48000
Create noisy speech signal as SNR 10
noisy, snr_measured = sp.dsp.add_backgroundsound(
    speech,
    noise,
    sr = sr,
    snr = 10,
    total_len_sec = 2,
    pad_mainsound_sec = 0.5)
Out:
/home/airos/Projects/github/a-n-rose/Python-Sound-Tool/soundpy/dsp.py:769: UserWarning:
Warning: `soundpy.dsp.clip_at_zero` found no samples close to zero. Clipping was not applied.

  warnings.warn(msg)
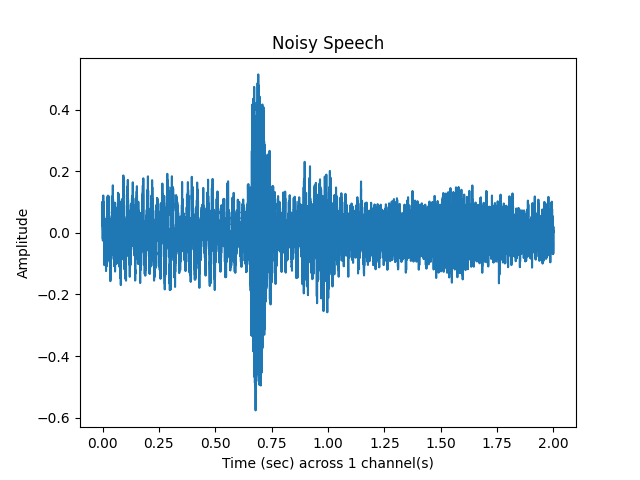
Hear and see the noisy speech
ipd.Audio(noisy,rate=sr)
sp.plotsound(noisy, sr=sr, feature_type='signal',
               title = 'Noisy Speech', subprocess=True)
Out:
/home/airos/Projects/github/a-n-rose/Python-Sound-Tool/soundpy/feats.py:117: UserWarning: Due to matplotlib using AGG backend, cannot display plot. Therefore, the plot will be saved here: current working directory
  warnings.warn(msg)
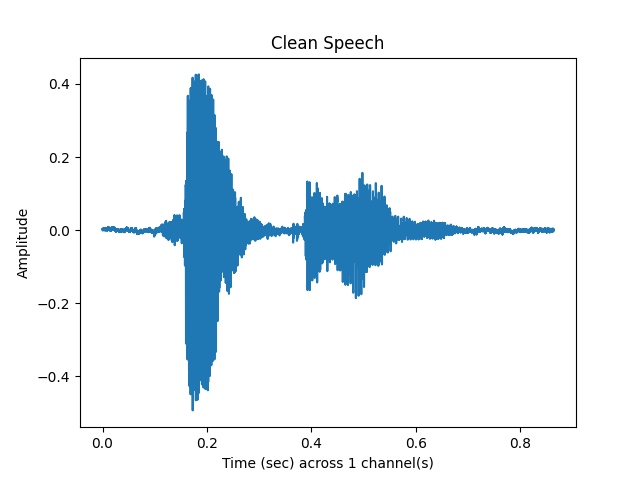
Hear and see the clean speech
sp.plotsound(s, sr=sr, feature_type='signal',
               title = 'Clean Speech', subprocess=True)
Out:
/home/airos/Projects/github/a-n-rose/Python-Sound-Tool/soundpy/feats.py:117: UserWarning: Due to matplotlib using AGG backend, cannot display plot. Therefore, the plot will be saved here: current working directory
  warnings.warn(msg)
Filter the noisy speech
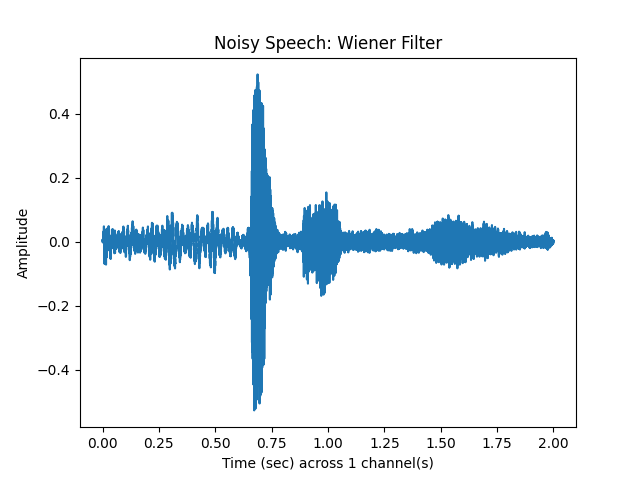
Wiener Filter
Let’s filter with a Wiener filter:
ipd.Audio(noisy_wf,rate=sr)
sp.plotsound(noisy_wf, sr = sr, feature_type = 'signal',
               title = 'Noisy Speech: Wiener Filter',
               subprocess=True)
Out:
/home/airos/Projects/github/a-n-rose/Python-Sound-Tool/soundpy/feats.py:117: UserWarning: Due to matplotlib using AGG backend, cannot display plot. Therefore, the plot will be saved here: current working directory
  warnings.warn(msg)
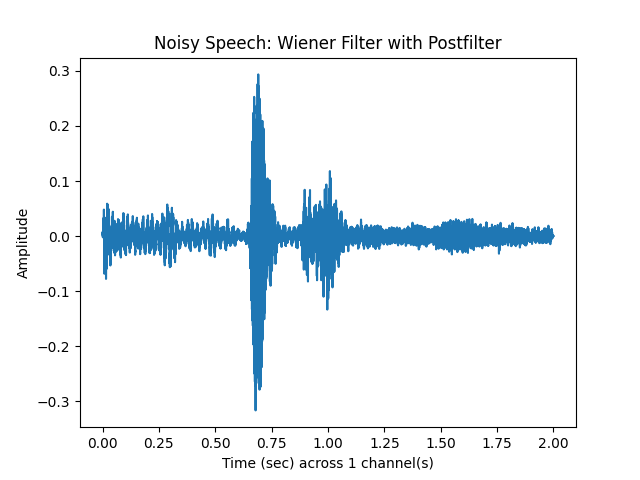
Wiener Filter with Postfilter
Let’s filter with a Wiener filter and postfilter
noisy_wfpf, sr = sp.filtersignal(noisy,
                                 sr = sr,
                                 filter_type = 'wiener',
                                 apply_postfilter = True)
ipd.Audio(noisy_wfpf,rate=sr)
sp.plotsound(noisy_wfpf, sr=sr, feature_type = 'signal',
               title = 'Noisy Speech: Wiener Filter with Postfilter',
               subprocess=True)
Out:
/home/airos/Projects/github/a-n-rose/Python-Sound-Tool/soundpy/feats.py:117: UserWarning: Due to matplotlib using AGG backend, cannot display plot. Therefore, the plot will be saved here: current working directory
  warnings.warn(msg)
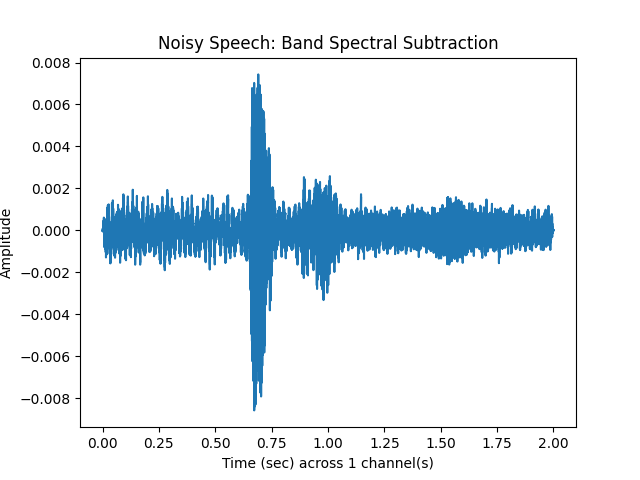
Band Spectral Subtraction
Let’s filter using band spectral subtraction
ipd.Audio(noisy_bs,rate=sr)
sp.plotsound(noisy_bs, sr = sr, feature_type = 'signal',
               title = 'Noisy Speech: Band Spectral Subtraction',
               subprocess=True)
Out:
/home/airos/Projects/github/a-n-rose/Python-Sound-Tool/soundpy/feats.py:117: UserWarning: Due to matplotlib using AGG backend, cannot display plot. Therefore, the plot will be saved here: current working directory
  warnings.warn(msg)
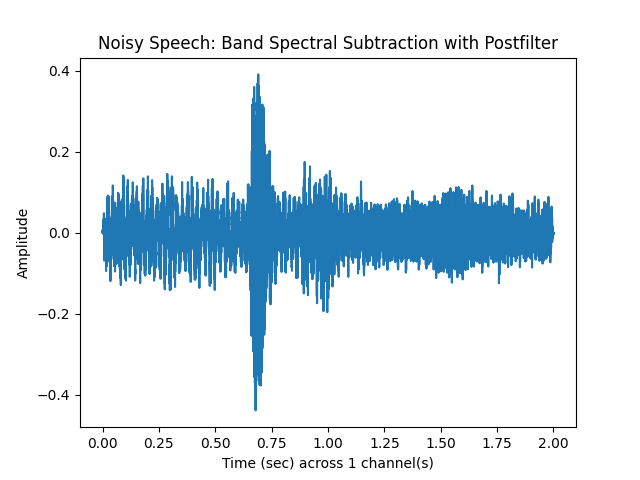
Band Spectral Subtraction with Postfilter
Finally, let’s filter using band spectral subtraction with a postfilter
noisy_bspf, sr = sp.filtersignal(noisy,
                                 sr = sr,
                                 filter_type = 'bandspec',
                                 apply_postfilter = True)
ipd.Audio(noisy_bspf,rate=sr)
sp.plotsound(noisy_bspf, sr = sr, feature_type = 'signal',
               title = 'Noisy Speech: Band Spectral Subtraction with Postfilter',
               subprocess=True)
Out:
/home/airos/Projects/github/a-n-rose/Python-Sound-Tool/soundpy/feats.py:117: UserWarning: Due to matplotlib using AGG backend, cannot display plot. Therefore, the plot will be saved here: current working directory
  warnings.warn(msg)
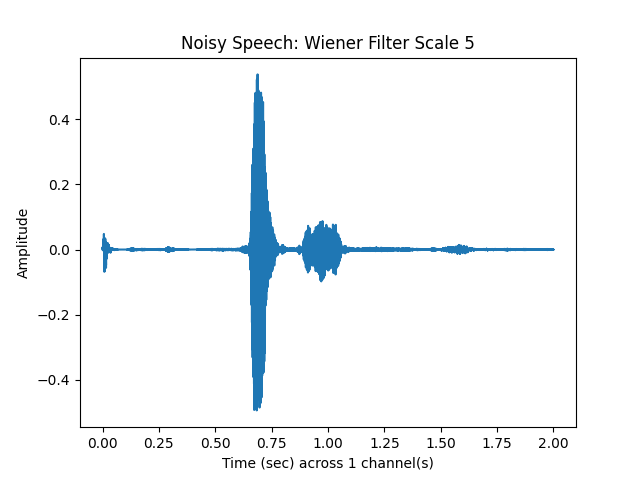
Filter: increase the scale
Let’s filter with a Wiener filter:
Wiener Filter
ipd.Audio(noisy_wf,rate=sr)
sp.plotsound(noisy_wf, sr = sr, feature_type = 'signal',
               title = 'Noisy Speech: Wiener Filter Scale {}'.format(filter_scale),
               subprocess=True)
Out:
/home/airos/Projects/github/a-n-rose/Python-Sound-Tool/soundpy/feats.py:117: UserWarning: Due to matplotlib using AGG backend, cannot display plot. Therefore, the plot will be saved here: current working directory
  warnings.warn(msg)
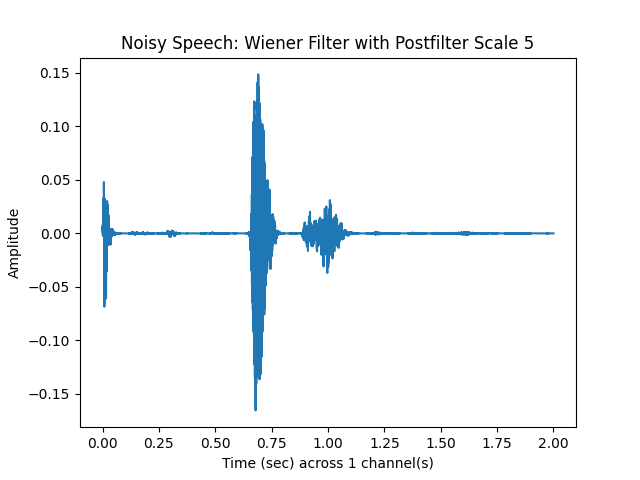
Wiener Filter with Postfilter
Let’s filter with a Wiener filter and postfilter
noisy_wfpf, sr = sp.filtersignal(noisy,
                                 sr = sr,
                                 filter_type = 'wiener',
                                 apply_postfilter = True,
                                 filter_scale = filter_scale)
ipd.Audio(noisy_wfpf,rate = sr)
sp.plotsound(noisy_wfpf, sr = sr, feature_type = 'signal',
               title = 'Noisy Speech: Wiener Filter with Postfilter Scale {}'.format(filter_scale),
               subprocess=True)
Out:
/home/airos/Projects/github/a-n-rose/Python-Sound-Tool/soundpy/feats.py:117: UserWarning: Due to matplotlib using AGG backend, cannot display plot. Therefore, the plot will be saved here: current working directory
  warnings.warn(msg)
Total running time of the script: ( 0 minutes 3.981 seconds)